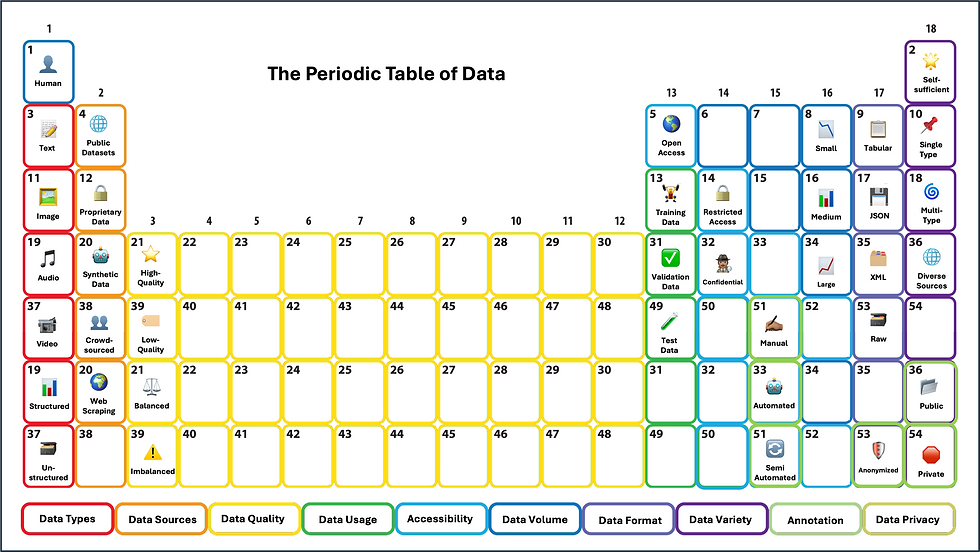
The Periodic Table of Data: Exploring the Elements of Information
- Felipe

- Aug 29, 2024
- 4 min read

Just as the periodic table organizes elements by their properties, understanding data means breaking it down into its basic parts. I’ll show you how different aspects of data can be compared to the periodic table.
I. Types of Data: The Basic Elements
In the same way that elements like hydrogen (H) and oxygen (O) are fundamental building blocks of matter, different types of data form the core of our information ecosystem:
Images 🖼️, Audio 🎵, and Video 📹 are like the basic elements—each essential and unique, forming the fundamental building blocks of multimedia.
Structured Data 📊 fits into databases and spreadsheets, making it easier to analyze.
Unstructured Data 🗃️ resembles the more complex and less predictable elements, requiring sophisticated methods for extraction and analysis.
II. Data Sources: The Origins of Elements
Just as elements can be sourced from different origins—earth, water, air—data originates from various sources:
Public Datasets 🌐 are like elements found abundantly in nature, freely accessible to everyone.
Proprietary Data 🔒 is like rare elements, held by specific entities and often more valuable.
Synthetic Data 🤖 is like artificially created elements in a lab, designed for specific applications.
Crowdsourced Data 👥 is like elements gathered from diverse sources, enriching our dataset.
Web Scraping 🌍 is akin to extracting elements from the vast environment of the internet.
III. Data Quality: Purity and Composition
Quality is crucial, just as the purity of elements affects their behavior:
High-Quality Data ⭐ is like pure, high-quality elements—reliable and consistent.
Low-Quality Data 🏷️ may lead to inaccuracies, like impure elements.
Balanced Data ⚖️ ensures fairness and avoids bias, like elements with balanced isotopes.
Imbalanced Data ⚠️ can cause distortions, like having an excess or deficiency of certain isotopes.
IV. Data Usage: Reactions and Applications
Data usage parallels how elements interact in chemical reactions:
Training Data 🏋️♂️ is like the catalysts that start the reactions in a model’s development.
Validation Data ✅ fine-tunes the process, like adjusting conditions to ensure the reaction proceeds correctly.
Test Data 🧪 evaluates the outcome, like testing the product of a chemical reaction.
V. Data Accessibility: Elemental Availability
The accessibility of data can be compared to how elements are available and used:
Open Access 🌍 is like abundant elements available for everyone to use.
Restricted Access 🔒 is like elements that are controlled and require permission to access.
Confidential Data 🕵️♂️ is like rare, precious elements that are closely guarded.
VI. Data Volume: Quantity and Scale
Data volume can be compared to the amount of each element in a sample:
Small 📉 datasets are like trace amounts of elements—manageable and focused.
Medium 📊 datasets offer a balance between size and complexity, like moderate quantities of elements.
Large 📈 datasets are like bulk quantities of elements, requiring significant resources to handle.
VII. Data Format: Structuring Information
Just as elements can form compounds in various structures, data comes in different formats:
Tabular 📋 data is like organized compounds, easily structured for analysis.
JSON 💾 and XML 🗂️ represent structured formats, like specific molecular structures.
Raw Data 🗃️ is like the raw, unprocessed materials, needing refinement.
VIII. Data Variety: Composition and Diversity
Data variety is like the diversity of chemical compounds:
Single Type 📍 data is like a pure element, straightforward and uniform.
Multi-Type 🌈 data combines various formats, much like complex compounds with multiple elements.
Diverse Sources 🌎 brings together data from various origins, like a mixture of elements from different environments.
IX. Data Annotation: Enhancing Properties
Data annotation improves the usefulness of data, like how elements are processed and enhanced:
Manual Annotation ✍🏽 is like traditional methods of refining and purifying elements.
Automated Annotation 🤖 utilizes advanced techniques to label data efficiently.
Semi-Automated Annotation 🔄 combines both approaches, much like using a mix of techniques for element processing.
X. Data Privacy: Protecting Information
Data privacy parallels the safety measures in handling sensitive elements:
Public Data 🌍 is like elements that are safe and widely available.
Anonymized Data 🛡️ is Similar to elements that are processed to ensure they do not reveal sensitive information.
Private Data 🛑 is closely guarded, like rare or hazardous elements that require stringent protection.
Data is Data and The Rest…
Just as the periodic table organizes elements based on their properties, understanding data through its various dimensions—types, sources, quality, and more—helps us harness its full potential. By drawing these analogies, we can better appreciate the complexity and importance of data in our information-driven world. Dive deeper into your data journey, explore its multifaceted nature, and apply these insights to make more informed decisions. Embrace the full spectrum of data to unlock new opportunities and drive innovation in your field. 📲 https://www.castroquiles.com


Comments